Translations:OpenACC Tutorial - Profiling/12/en
Jump to navigation
Jump to search
PGPROF Profiler
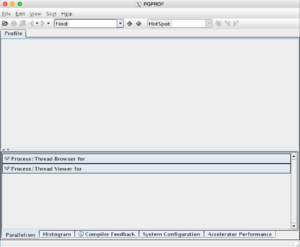
These next pictures demonstrate how to start with the PGPROF profiler. The first step is to initiate a new session. Then, browse for an executable file of the code you want to profile. Finally, specify the profiling options; for example, if you need to profile CPU activity then click the "Profile execution of the CPU" box.
