Translations:PGPROF/17/en
Jump to navigation
Jump to search
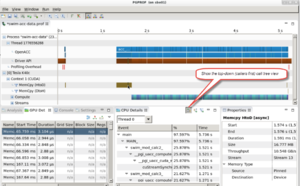
The visualization window is comprised of four panes:
- The pane on the upper right shows the timeline with all the events ordered by the time at which they were executed.
- GPU Details: shows performance details for the GPU kernels.
- CPU Details: shows performance details for the CPU functions.
- Properties: shows all the details for a selected function in the timeline window.
